Signal Properties
This section describes the Signal Properties dialog.
The Signal Properties dialog allows you to change the graphic properties of the plotted signals.
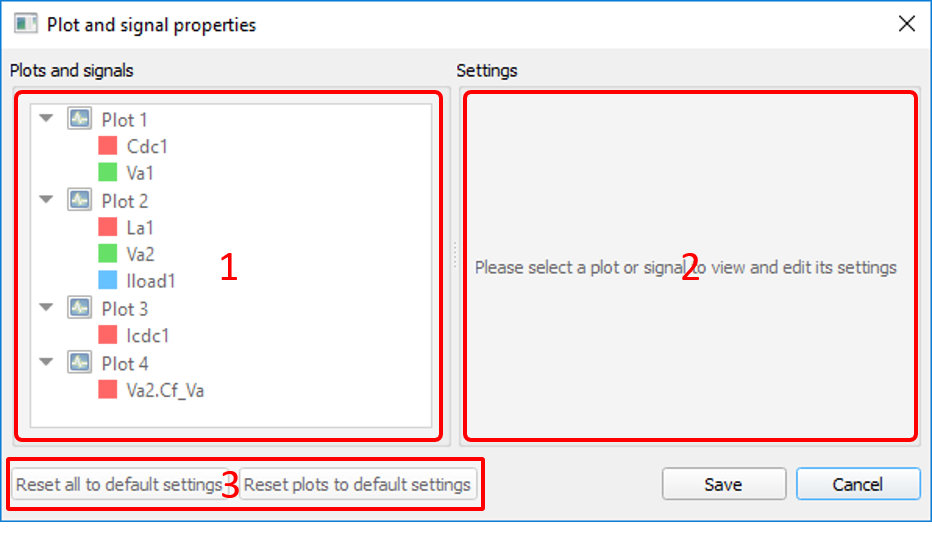
- Tree panel - contains elements which represent all the plots and their signals. By clicking on an element within the tree panel, the Settings Panel will display the selected element's editable properties. (number 1 in Figure 1)
- Settings panel - contains all the editable properties of the selected signal in the tree panel. Initially, this panel displays a message prompting the user to make a selection in the tree panel. (number 2 in Figure 1)
- Reset all signals to default button - Used to reset signals (color and line type) to default. (number 3 in Figure 1)
By selecting a subplot in the Tree panel, the settings panel will display a prompt to select a signal to edit (number 1 in Figure 2).
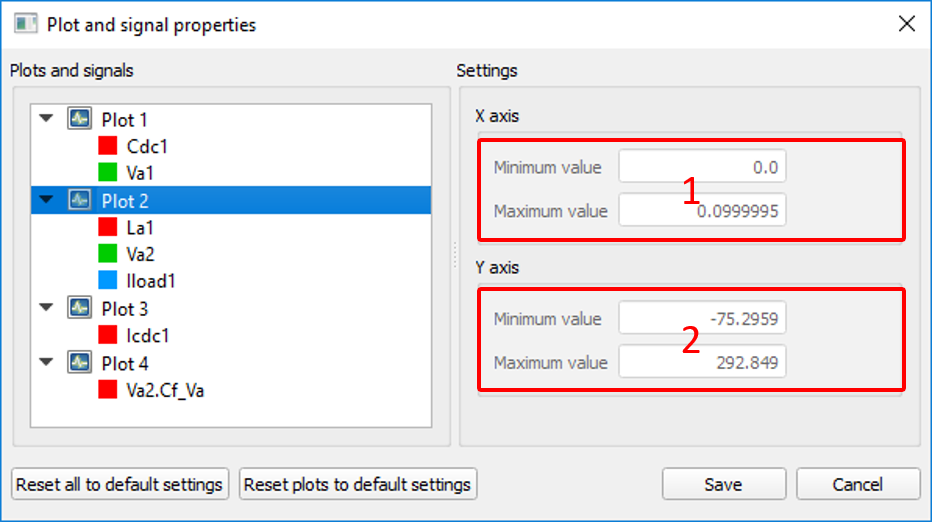
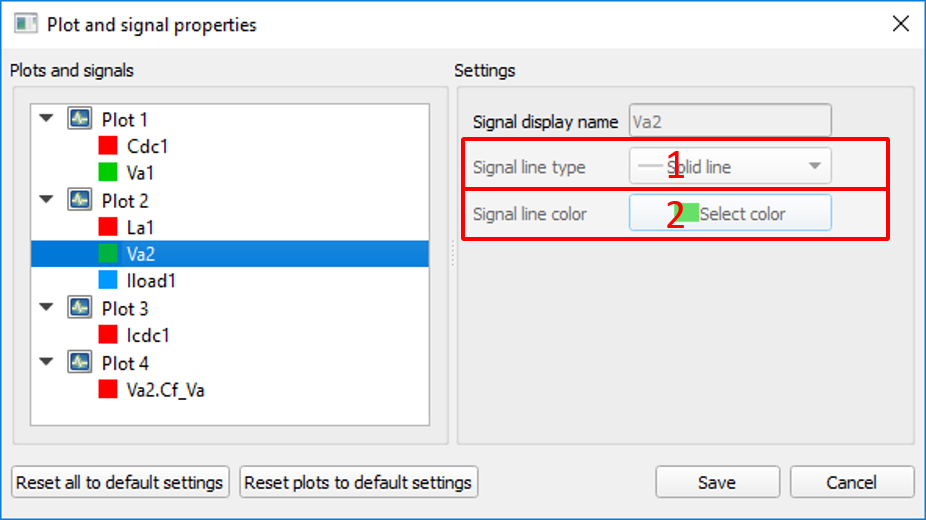
By selecting a signal and switching to manual settings mode, both the line type and the line color can be customized. Line type (number 1 in Figure 3) can be set to solid - default, dotted, dashed, dash-dotted, and dash-dot-dotted. Line color (number 2 in Figure 3) can be set to any color available in the Select Color dialog, which is displayed when the Select Color button is clicked. When left in auto mode, the subplot determines the style of the plotted signal.