Monitoring widgets
This section describes monitoring widgets
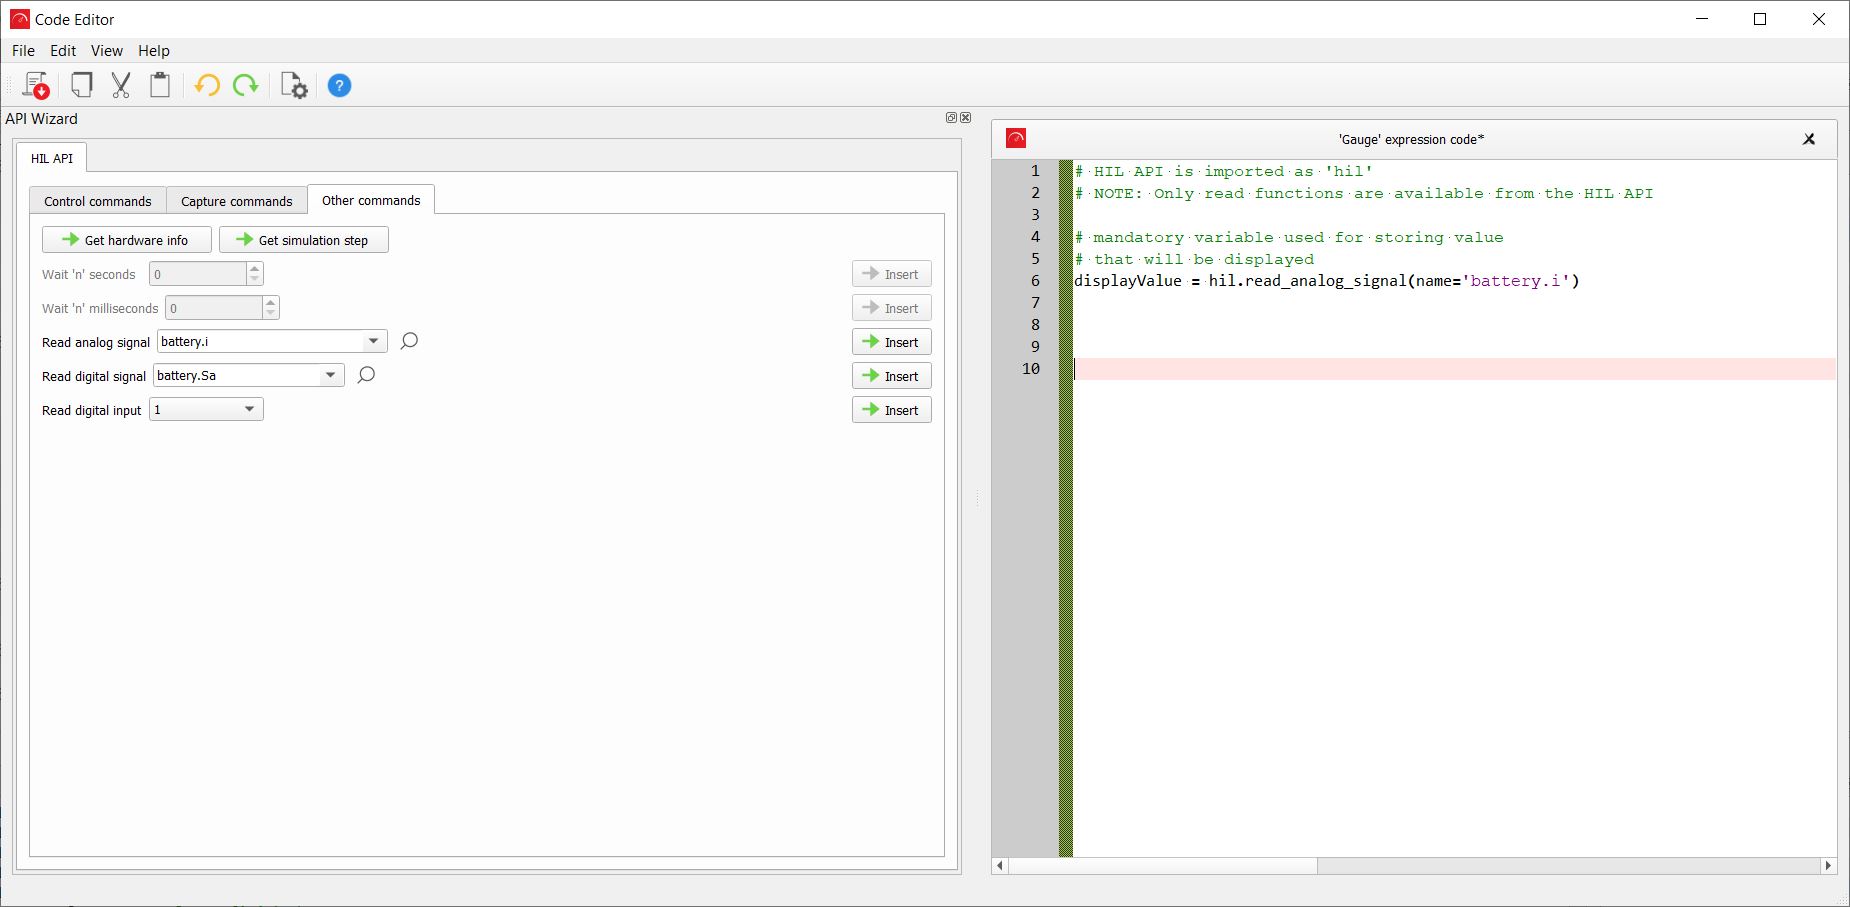
Monitoring widgets can read and display real-time values of any Analog or Digital signal available in the model. In addition to that, you can define the value displayed by a Python Expression (Figure 1). This way, you can define an arbitrarily complex relationship between signal values acquired from the simulation and the value being displayed.
You can specify the update rate independently for each of the inserted monitoring widgets.
There are a few widgets available in this group:
- Gauge, Digital Display, Text Display, Trace Graph, XY Graph, Phasor Graph and Bar
Graph widget - these widgets are intended to read Analog signals available in the
model. The main difference between them is how they visually represent the collected
data.Note: In addition to Analog signals, Trace Graph can also read Digital signals, Streaming Analog and Streaming Digital signals.
- LED - this widget can read Digital signal available in the model.
- PV Monitor – a special type of a monitoring widget whose purpose is to display the operating point of the selected PV panel. This widget does not support Python Expressions.
- Capture/Scope – this is the special Monitoring widget that enables you to easily capture the desired signals or to use embedded scope to continually observe signals directly from the connected HIL device.
Note: You can read more about Capture/Scope widget in the Capture/Scope Widget section of this
document.
Note: Only HIL API read functions are available in this context. Other Typhoon APIs (such as
Schematic Editor API) are not supported in this context.