Execution rate visualization
This section describes execution rate visualization
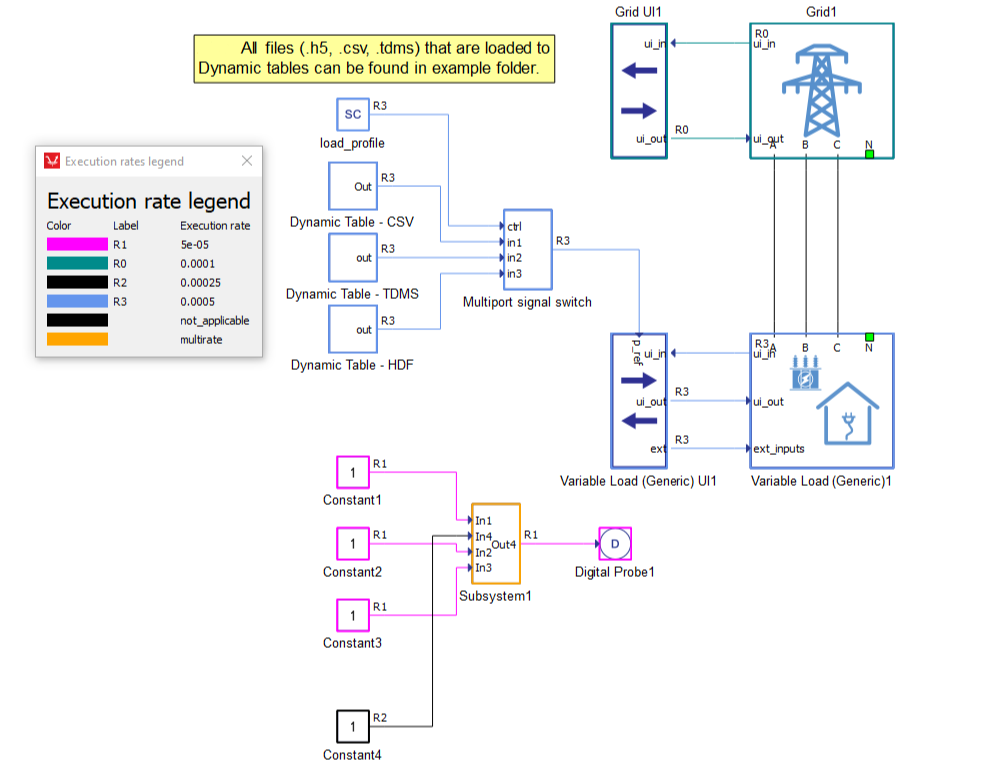
Execution rate visualization provides functionality to visually distinguish parts of a schematic (signal processing parts of schematic) at different execution rates.
There are two types of visualization (which can be enabled separately or both at the same time):
- Visualization by Execution rates using color
Parts of schematic (signal processing items and connections) at the same execution rate will be highlighted with the same color. To see which color represents some concrete execution rate, activate the Execution rate legend dialog using the F6 shortcut.
- Visualization by Execution rates using annotations
Execution rate annotations visualize execution rate by showing labels at signal processing component out terminals (where connections start). Label content is not the actual execution rate number, but rather a shortcut which can be mapped to the actual execution rate using the Execution rate legend dialog (F6 keyboard shortcut).
To activate a specific execution rate visualization select Model -> Visualize model by and then specific action. These actions can also be reached from the schematic context menu (Using the mouse right click over an empty area in the schematic).
You can refresh the execution rate visualization from the Schematic context menu with the Refresh model option. Visualization is also refreshed by compiling the schematic for active components.