Time Slot Monitor
Description of the Time Slot Monitor in HIL SCADA
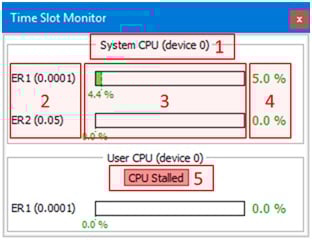
Time Slot Monitor consists of:
- Monitoring object – specifies the processing unit and the HIL device being monitored
- Execution rates – lists execution rates of the monitoring object
- Current usage – shows the current time slot usage for all execution rates
- Maximum usage – shows the maximum detected time slot usage for all execution rates
- CPU Stalled – indicates if the CPU is stalled
CIO problems and solutions:
User CPU reached 100% usage – you should increase the execution rate of signal processing components. Compile the model, run the simulation and observe the User CPU usage. This procedure should be applied iteratively until the CIO is eliminated. You should be mindful that raising the signal processing execution rate above certain limit can affect the simulation’s fidelity. In that case the solution is to remove the unused signal processing components from the model, or simplify the model implementation.
System CPU reached 100% usage - you should increase the execution rate of the System CPU in: Schematic Editor -> Model -> Schematic settings -> Signal processing settings -> System SP settings -> Execution rate. Compile the model, run the simulation and observe the System CPU usage. This procedure should be applied iteratively until the CIO is eliminated. You should be mindful that raising the System CPU execution rate above certain limit can affect the simulation’s fidelity. In that case the solution is to remove the unused components that utilize the System CPU (i.e. excessive RMS measurements).
- Change the optimization level to no optimization in Schematic Editor -> Model -> Schematic settings -> Signal processing settings -> User/System SP settings -> Compiler optimization level.
- To compensate for the fact that the code is not optimized, the execution rate of signal processing components will probably need to be increased.
- Reset the HIL device, compile the model, run the simulation and observe CPU flags.
- If a CIO flag is still present, repeat steps 2 and 3 until all flags are eliminated.
- When all the flags are eliminated, try increasing the optimization level to medium or high, and then try running the model again.