This section describes the Plot and Signal Properties window
The Plot and Signal Properties window allows you to change the graphic properties of the
plotted signals, as well as the X and Y ranges of the plots.
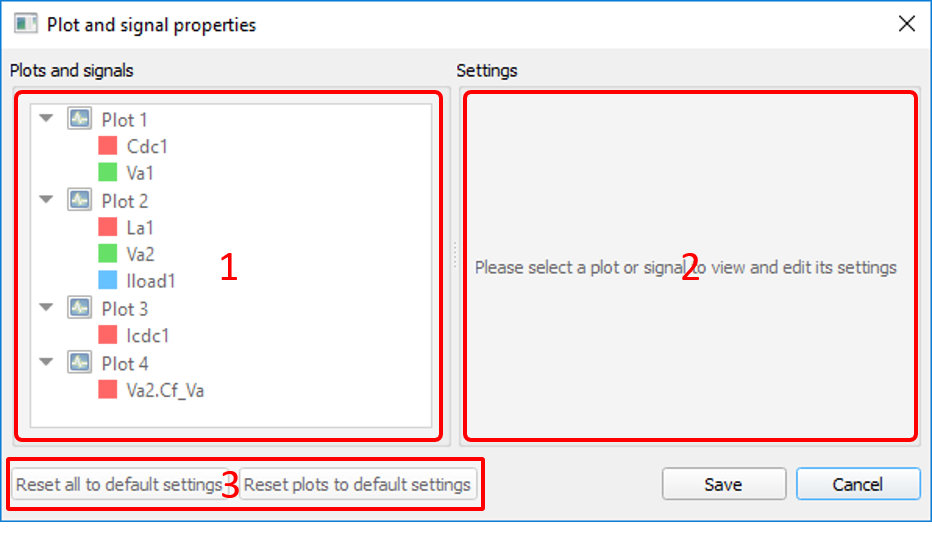
This window contains the following elements:
Tree panel - contains elements which represent all the plots and their
signals. By clicking on an element within the tree panel, the Settings Panel
will display the selected element's editable properties. (number 1 in Figure 1)
Settings panel - contains all the editable properties of the selected
tree element - either a plot or a signal. Initially, this panel displays a
message prompting the user to make a selection in the tree panel. (number 2 in
Figure 1)
Reset buttons - there are two ways to reset the settings. The first is to
reset all the values of every element to their defaults, meaning that both plot
settings (X and Y range) and signal settings (color and type) will be reset. The
second way to reset the settings is reset only plot settings (X and Y range),
while keeping the signal settings. (number 3 in Figure 1)
Note: By saving the settings, all future data captures will be displayed with these
settings if the settings are enabled on the Plotting options toolbar in the Capture
widget/TyphoonSim Scope.
Note: These settings are saved to the GUI (.CUS) file, as well as the state of the
settings toggle button.
If the panel for real time
simulation is saved with the settings toggled on, the settings will be applied
automatically the next time the panel is loaded from file.
If the Scope for TyphoonSim simulation is saved with
the settings toggled on, the settings will be applied automatically the next
time the model is loaded.
Figure 1. Plot and signals properties window
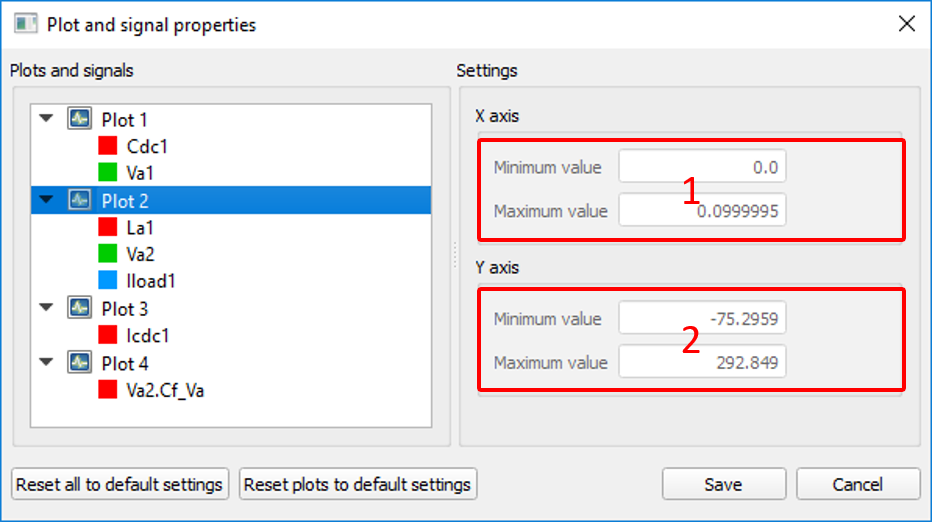
As mentioned, depending on the selection in the Tree panel, the Settings panel can
display settings for:
Plots - minimum and maximum ranges for the X axis (number 1 in Plot settings) and Y axis (number 2 in Plot settings).
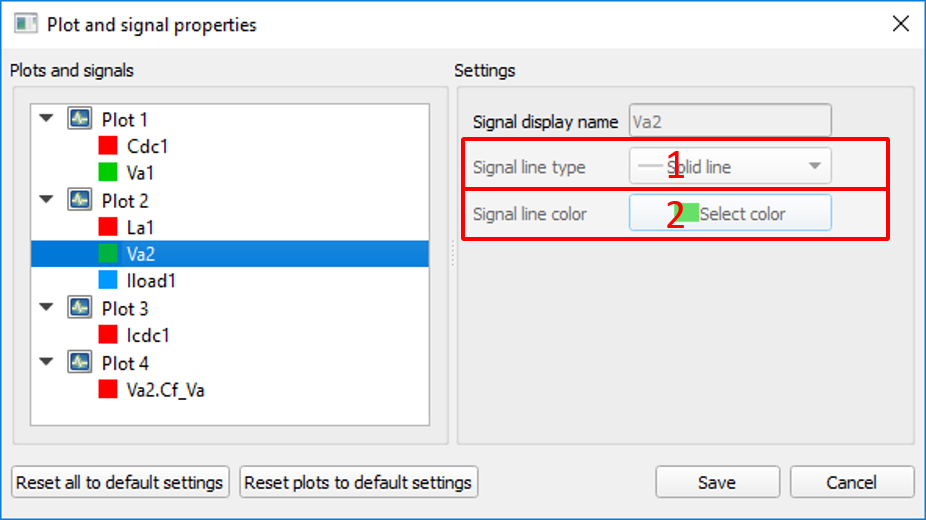
Signals - line type (number 1 in Signal settings) which can be solid - default, dotted, dashed,
dash-dotted and dash-dot-dotted, and line color (number 2 in Signal settings) which can be any color available in the color
picker dialog which is displayed when the Select Color button is clicked.