Command toolbar
This section describes command toolbar
Real-time only: This document is valid only for real-time/VHIL
simulation.
The Command toolbar consists of elements shown below:
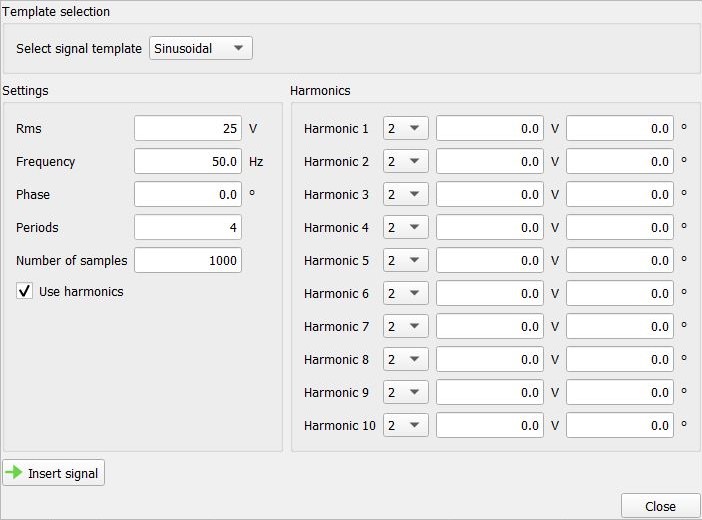
 Add a new signal to the plot. The user can select an appropriate signal
template and configure the necessary parameters (Figure 1). After adding the new signal, the currently
displayed (plotted) signal will not be shown anymore.
Add a new signal to the plot. The user can select an appropriate signal
template and configure the necessary parameters (Figure 1). After adding the new signal, the currently
displayed (plotted) signal will not be shown anymore.
 opens a saved .isg source waveform file.
 saves the generated signal data to an .isg file used by the HIL
SCADA.
saves the generated signal data to an .isg file used by the HIL
SCADA. import signal data from a .mat or .csv file.
Note: A MAT file should contain a single one-dimensional variable with the length of up to 2048
entries. The variable represents the voltage or current waveform samples. The variable should not
contain any time information.
Note: A CSV file should contain single-column y-signal values with up to 2048 entries. The values
represent the voltage or current waveform samples. It should not contain any time
information.
 exports the generated signal data to .mat or .csv file.
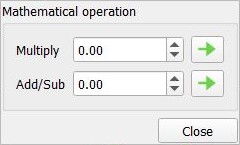
 applies a mathematical transformation to the selected signal points (Figure 2).
- Time step spin box for defining waveform sample period.
- Time unit combo box for selecting time axes unit.
- Generated signal information (Figure 3).
