Signal Analyzer
This section describes the Signal Analyzer tool.
Signal Analyzer is a tool used for visualization and analysis of signal data exported within Typhoon HIL software or dynamically imported from HIL SCADA. It shares the same visualization and signal analysis functionality with the Capture/Scope HIL SCADA widget.
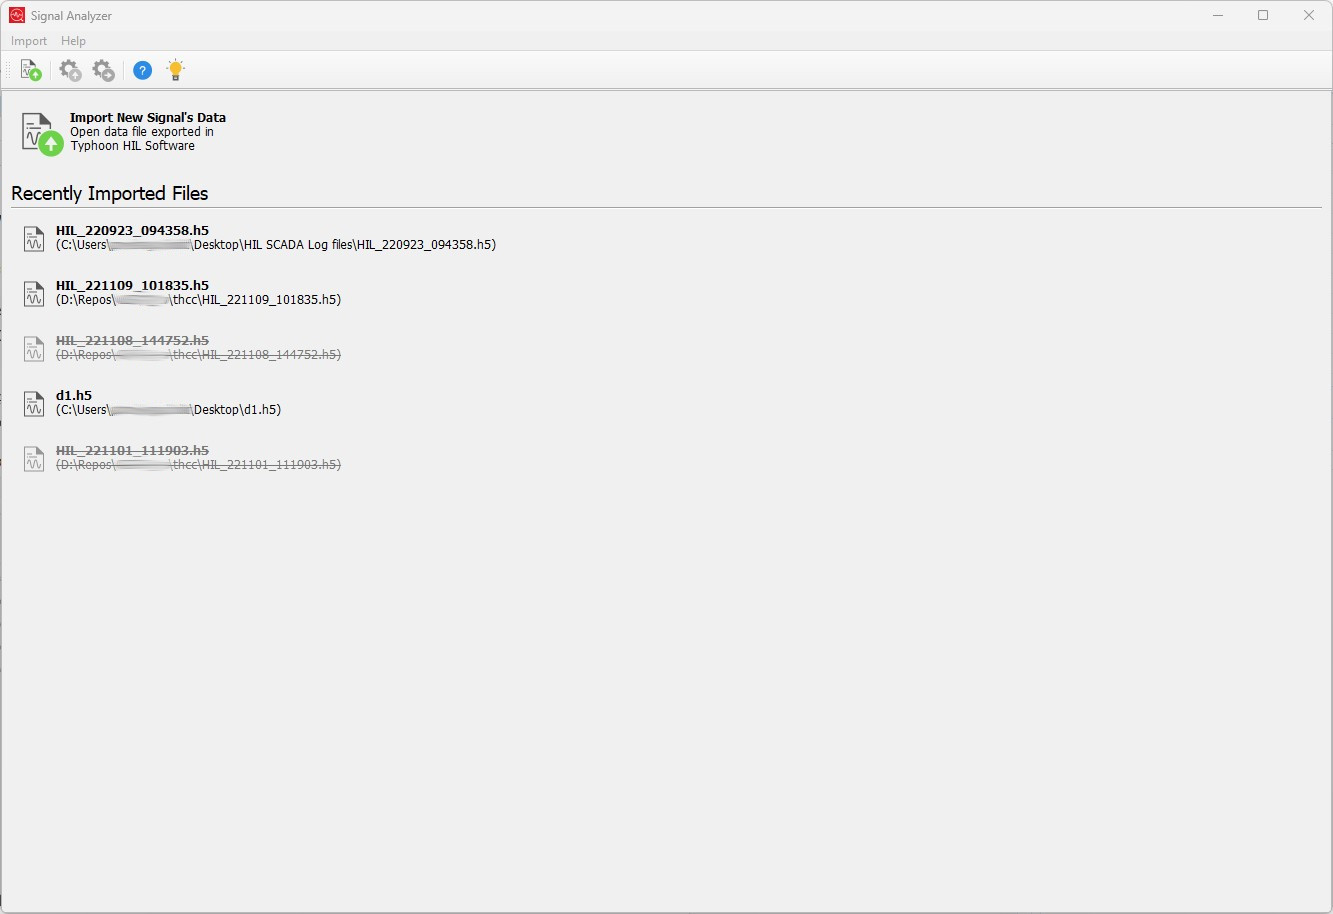
After Signal Analyzer is opened, you will notice the similar start-up screen as is the case in HIL SCADA and Schematic Editor: the screen shows recently imported signal data files (Figure 1).
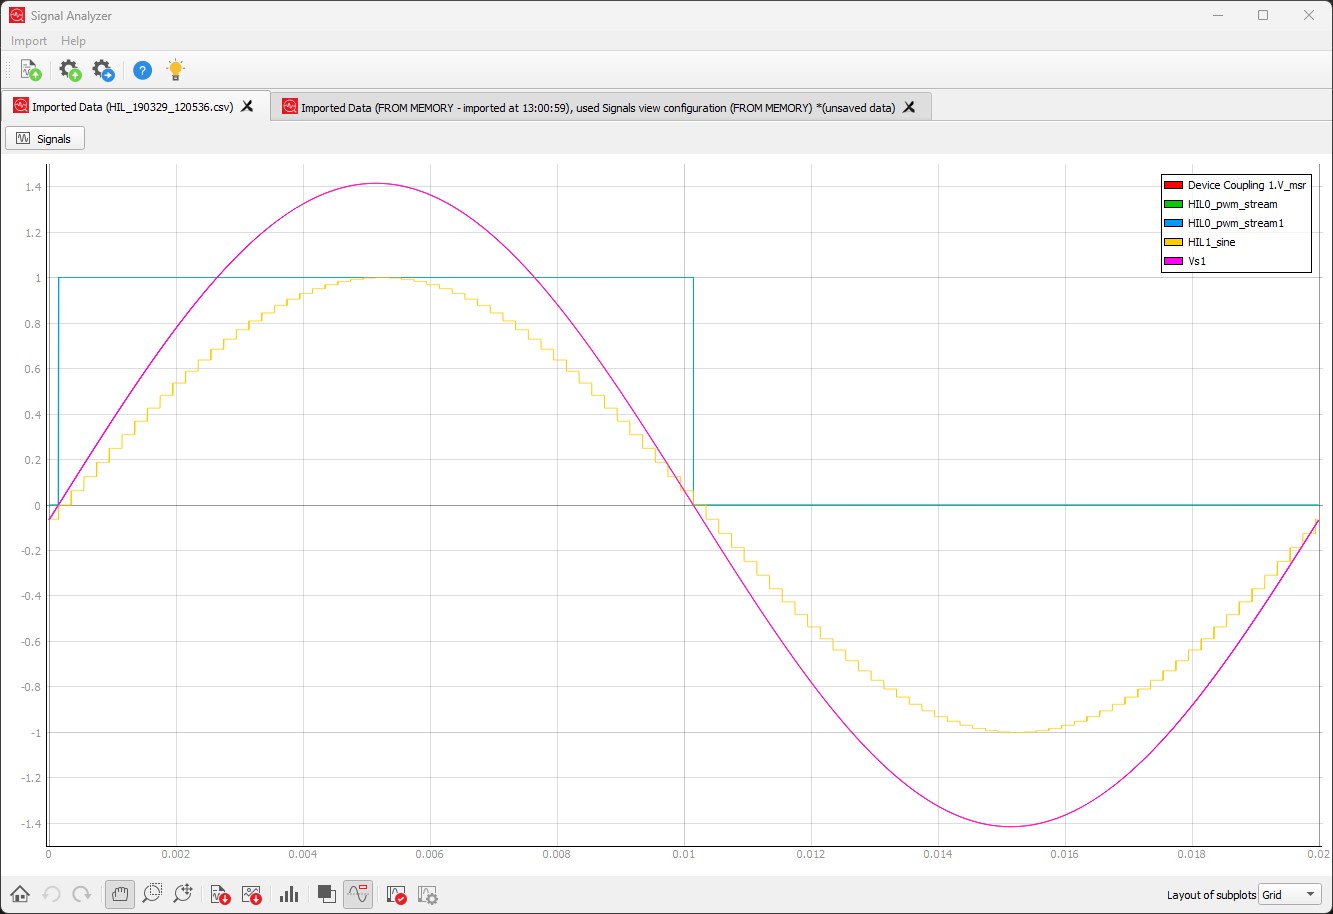
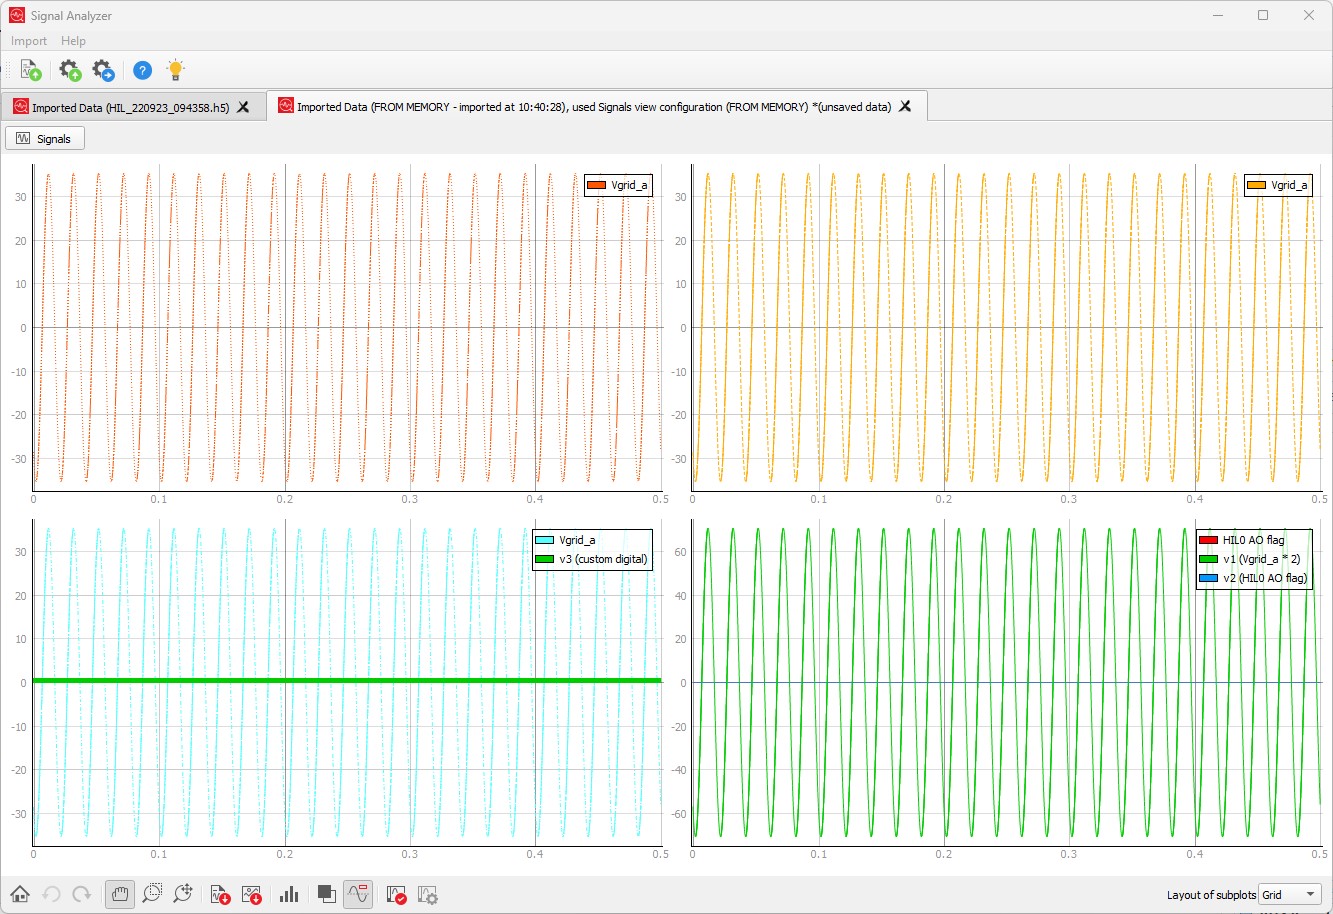
Each time you open a signal data file (Figure 2) or import data from HIL SCADA (Figure 3), a new tab with all visualized signals will be opened.
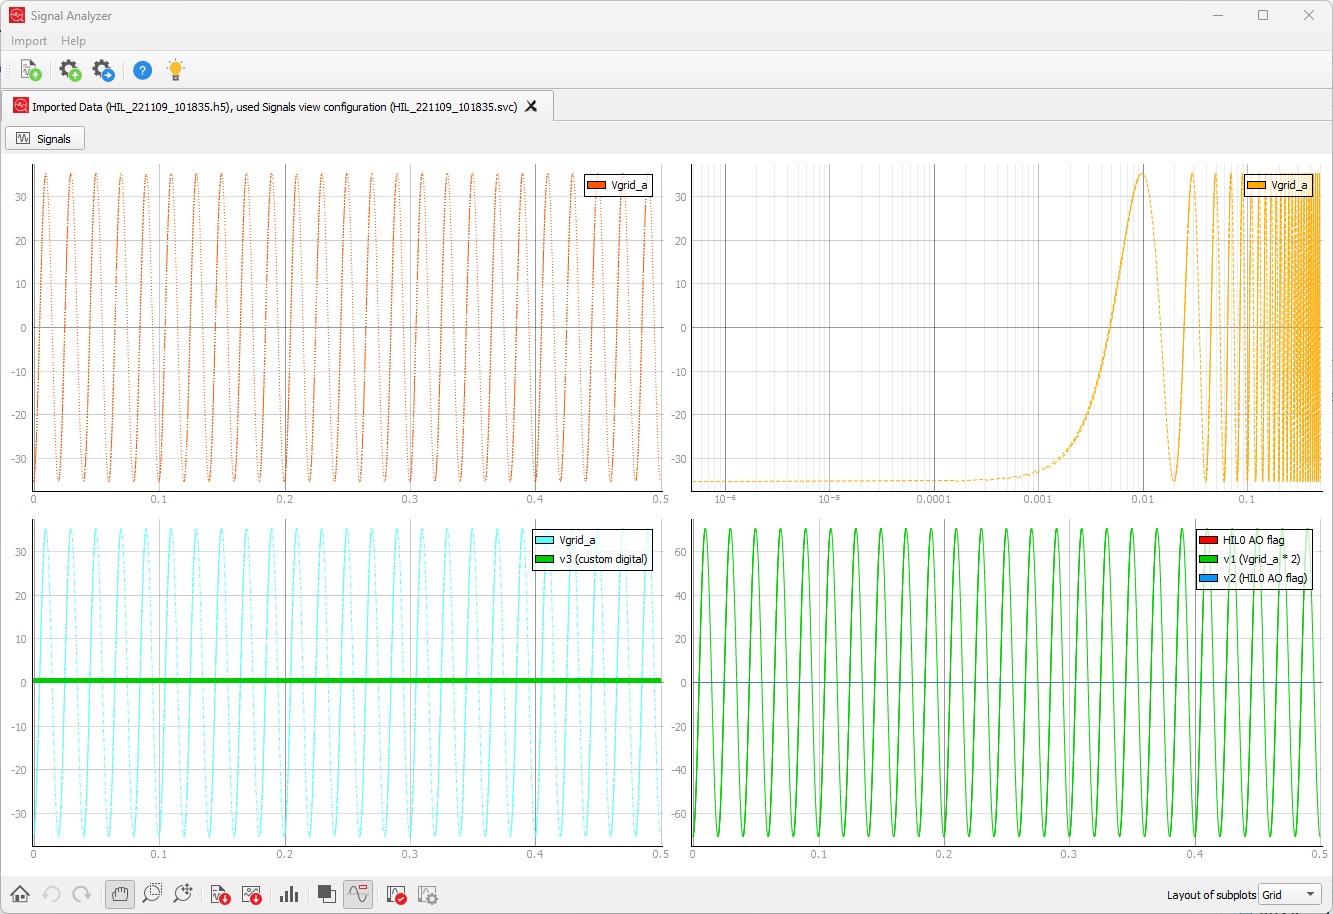
Signal Analyzer can save the current Signals View configuration by clicking on the  toolbar action or by manually loading the .svc file by clicking on
  . In this way, you can have
multiple Signals View Configuration files for one loaded signals data file.
. In this way, you can have
multiple Signals View Configuration files for one loaded signals data file.
As mentioned above, visualization and data analysis part is identical to the same functionality found in Capture/Scope. Therefore, for detailed explanation how to use various visualization options and data analysis functionality, please consult Capture/Scope documentation (Capture/Scope plotting options)
usage: typhoon_hil sa [--data_file DATA_FILE]

required arguments:
  --data_file DATA_FILE
                        Load specified signals data file (HDF5 (*.h5); CSV
                        (*.csv); MATLAB MAT (*.mat); NI TDMS (*.tdms); ASAM
                        MDF (*.mf4); COMTRADE CFG (*.cfg); COMTRADE DAT
                        (*.dat); COMTRADE CFF (*.cff)).
The "sa" option stands for "Signal Analyzer".
If for some reason you don't have typhoon_hil in path by default, you can execute commands directly on the Typhoon HIL Control Center executable. For example:
C:\>cd "C:\Program Files\Typhoon HIL Control Center 2019.4\"
C:\Program Files\Typhoon HIL Control Center 2019.4>typhoon_hil.exe sa <<commands>>