Lookup table - Chart area
Overview of the Lookup table chart area and how you can interact with it
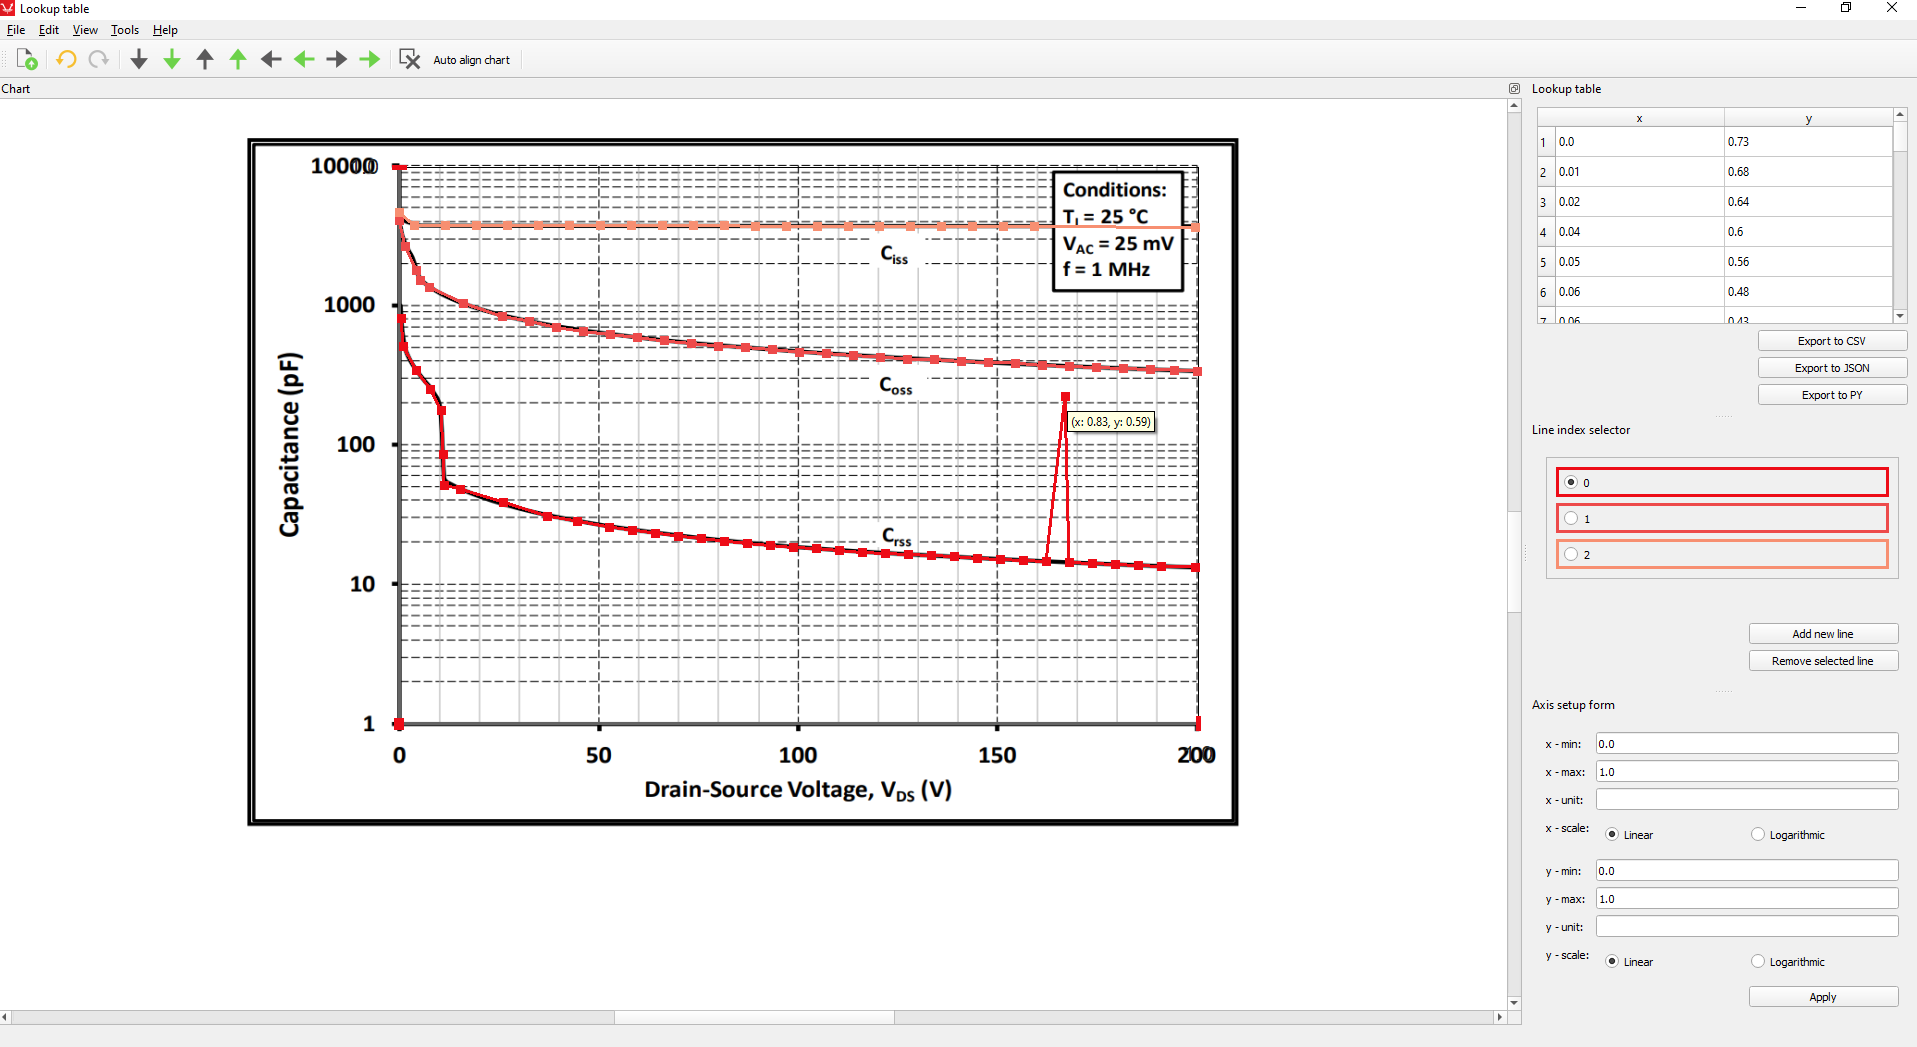
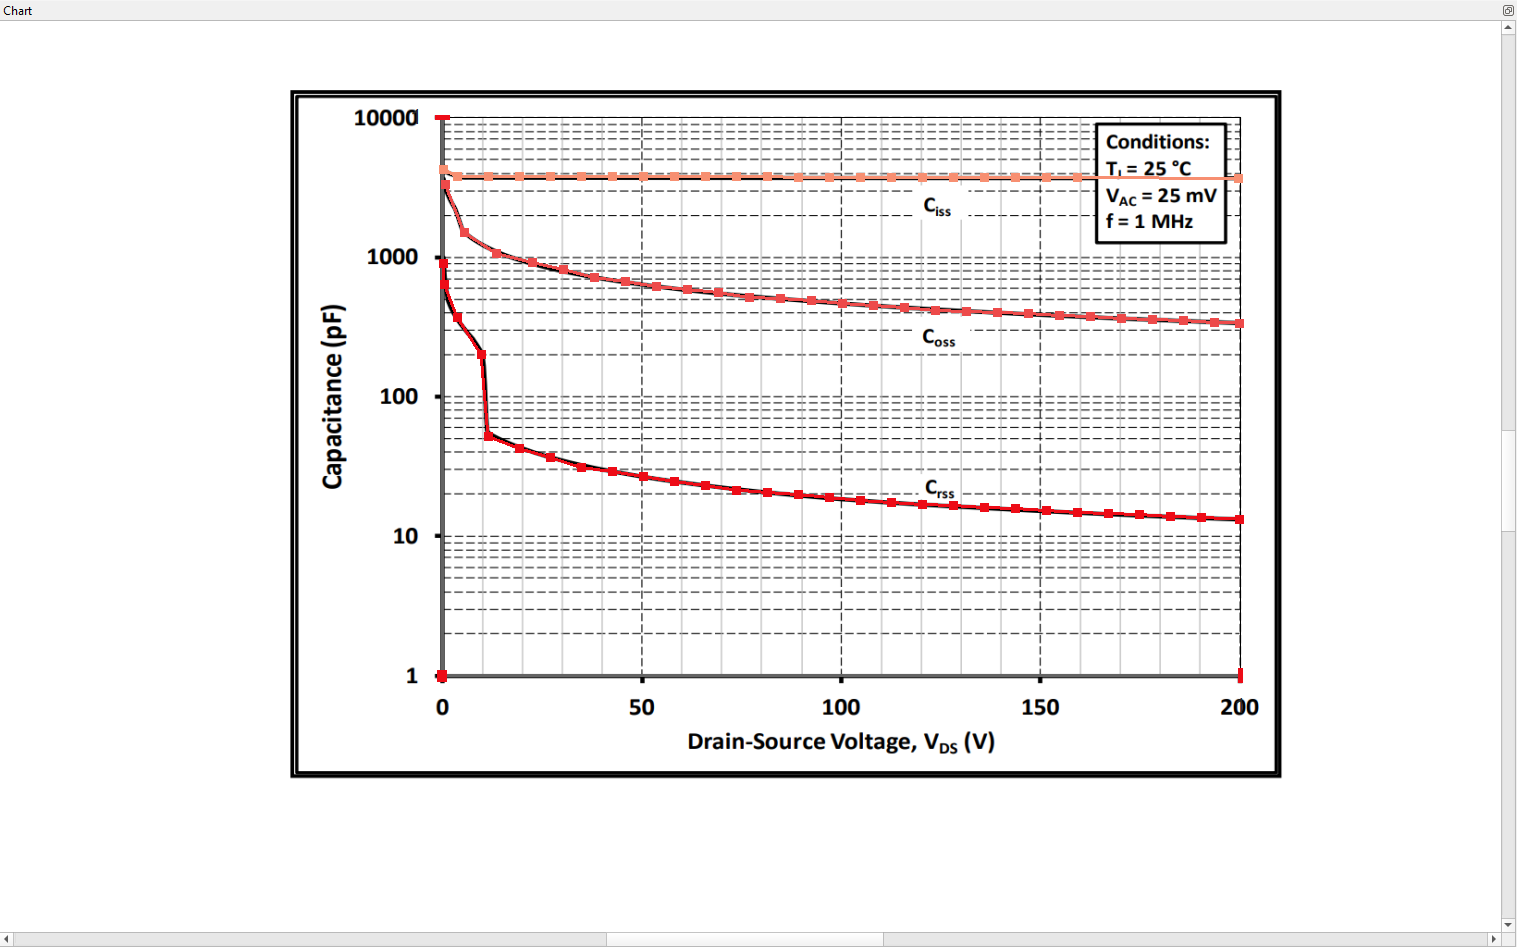
The chart area is the main panel of the Lookup table extraction tool. It is used for visualizing the chart, resizing axes, and point manipulation in order to fit the curve of the uploaded figure. You can upload a figure by navigating to "File > Upload chart image. Zoom and pan controls are also supported.
The controls for interacting with the chart area are:
- Ctrl + Left click - Insert new point at mouse position
- Left click + Drag - Move currently hovered point
- Middle click + Drag - Pan
- Alt + Right click - Remove hovered point
- Mouse scroll up - Zoom in
- Mouse scroll down - Zoom out
If you have a line already selected, such as with the Lookup table - Line index selector, inserting a new point on the chart will automatically assign it to that line, as shown in Figure 2. In this figure, the line with index=0 is selected, so the point is added to that line.