Results map
Overview of the Results map is a visual representation of the outcome of tests, accessible from the Analyze section of Typhoon Test Hub.
The Results map (Figure 1) is a visual representation of the outcome of tests across multiple Jobs. It lets you quickly identify areas that require attention and analyze the overall performance of the system. For each test, the test status can be:
- Broken - shown with the
 icon,
icon, - Passed - shown with the
 icon,
icon, - Failed - shown with the
 icon.
icon. - Skipped - shown with the
 icon.
icon. - Unknown - shown with the
 icon.
icon.
Clicking on any of icons will open the corresponding Allure report for that precise execution and test case in a new tab.
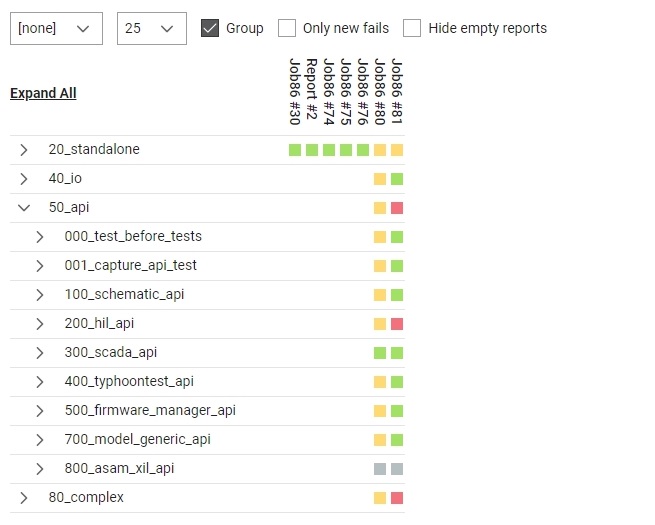
- The checkbox Group can be used to group tests by directory.
- If the checkbox Only new fails is checked, only tests that were passing and have failed in the last execution will be shown.
- If the checkbox Show flaky tests is checked, then tests that had at least one passed, and failed or broken test in the last 5 executions will be shown.
- If the checkbox Hide empty reports is checked, then empty reports will be hidden.
- If the checkbox Show individual assertions is checked, all individual assertions for each test will be displayed. Individual assertions correspond to specific tests steps for which statuses were explicitly collected. More information on how individual assertions are defined and recorded can be found in the tth-api-client documentation.
When grouping the results, the Icon will display the worst test result within that group. For example, if there is at least one Broken test, the group will have the Broken Icon; if there are Broken tests and at least one Failed test, it will have the Failed Icon. The Passed icon will appear only when all tests have Passed.
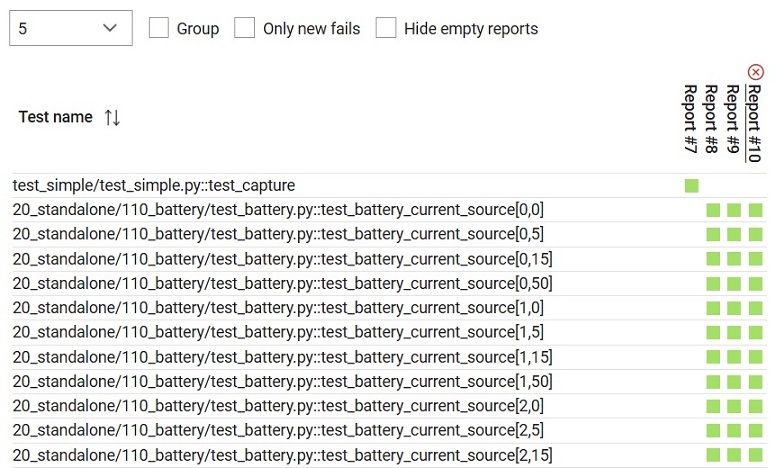
When a report is hovered,  button appears, allowing the user to remove that specific
Report from the results map. Once the page is refreshed, the removed Report will be
visible again.
button appears, allowing the user to remove that specific
Report from the results map. Once the page is refreshed, the removed Report will be
visible again.
By clicking on the button  data belonging to the filtered reports (with statuses of
its executed tests and individual assertions) can be downloaded in one of the following
formats: json, xml and csv.
data belonging to the filtered reports (with statuses of
its executed tests and individual assertions) can be downloaded in one of the following
formats: json, xml and csv.