Time filters
Overview of time filters, which can be used to filter results in graphs or report pages.
Time filters allow you to filter executions and other data with time intervals. For example you can customize graphs on the Overview page.

 button, columns of the table
can be customized - hidden or shown depending on the preference. Columns of the table
can be reordered by using drag and drop in the table header. When positioning cursor in
between two columns, cursor for column resizing will show and enable change of the
column's width. All changes made to the table will be automatically preserved.
button, columns of the table
can be customized - hidden or shown depending on the preference. Columns of the table
can be reordered by using drag and drop in the table header. When positioning cursor in
between two columns, cursor for column resizing will show and enable change of the
column's width. All changes made to the table will be automatically preserved. Create Time Filter
A new Time filter can be added by clicking on the  button.
An already existing Time filter can be duplicated by clicking on the
button.
An already existing Time filter can be duplicated by clicking on the  button.
There are two types of time filters:
LAST - In this type of time filter you select how far in the past you want to look. For example you can choose "last 7 days" or "last 1 month" as in the Figure 2 image. Available time units are: hour, day, month, and year. The value should be a positive integer. This filter will get you results since that time moment until now. The chosen time filter is always recalculated relative to the current time.
RANGE - In this type of time filter you select a fixed moment in time to start and end data gathering. This filter can be used to get data "between April 1st and April 4th" or "November 2023" or just "2023". Select the start and end point using two calendar input elements as in the Figure 4 image. Also, the time filter can use a time range where the start point is defined and use the current time as an end point. For example, you could get results "from Jan 1st to now" as in the Figure 3 image.


Filter usage
On the Analyze Reports or Analyze Executions page you can use time filters to display only data generated in the selected time period. All filtering on this page is temporary and it resets when you move away from this page.

You can select filters that you previously created through the dropdown element.
Clicking the wrench icon will take you to the Time Filters page where you can create, update or delete time filters.
Clicking the plus button will open a custom time filter dialog where you can quickly create new filter and apply it. This filter is temporary by default and will disappear after you move away from the page.

You can tick the Save permanently option to also save a custom filter when you apply it by giving it a name.

By clicking on the  button, Filter presets page will be opened where user can further configure filters if needed.
Filter usage on charts
On the Overview page you can customize charts by applying time filters. Applied time filters will be remembered in your browser's cache and they will be applied every time you open the Overview page.
Line graph is showing test result trends from recent executions. In the top right corner you can select the options button and filter executions by two criteria: Execution filter and Time filter. Your selection will be shown in Graphs Title.

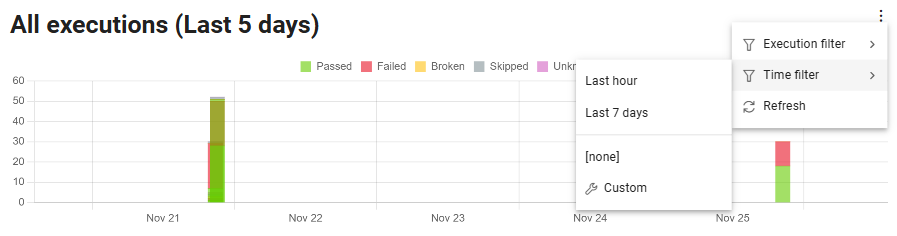
The Bar graph is similar to the Line graph, except the X axis is time proportional and you can see exactly when executions were finished. Figure 9 shows what it looks like when custom time filter is applied (last 5 days). Custom filter can be created and applied to the data by choosing the Custom option from the menu, which will open dialog for custom filter creation. Clicking on the [none] option will reset filter usage on the chosen graph and all executions will be shown.
Usage graphs are available for Agents, Setups, and HIL devices, and also have the ability to apply time filters.

Percentage graphs can be seen on Monitor Resource pages. They are available for Agents, Setups and HIL devices. These can use time filters as well.
