Reports
Overview of Allure reports, accessible from the Analyze section of Typhoon Test Hub.
Reports are generated upon completion of a test execution. You can see the most important information about available reports in the Reports table (Figure 1). Additional information on how to upload reports can be found in the Execution command section.
The Report table shows following informations:
- ID unique report identifier
- Name of a Job from which the execution is created
- Time when Execution started
- Time when Execution finished
- Duration of Execution
- Number of total tests in execution
- Success rate in percentage.
 button, columns of the table
can be customized - hidden or shown depending on the preference. Columns of the table
can be reordered by using drag and drop in the table header. When positioning cursor in
between two columns, cursor for column resizing will show and enable change of the
column's width. All changes made to the table will be automatically preserved.
button, columns of the table
can be customized - hidden or shown depending on the preference. Columns of the table
can be reordered by using drag and drop in the table header. When positioning cursor in
between two columns, cursor for column resizing will show and enable change of the
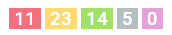
column's width. All changes made to the table will be automatically preserved. - Passed - Test finished successfully with all passed assertions
- Failed - Test finished unsuccessfully with at least one failed assertion
- Broken - Test did not finish due to an unexpected error that interrupted its execution
- Skipped - Test was skipped
- Unknown - Result of test does not correspond to any of the above listed statuses
- Allure (
 )
) - Html (
 )
) - Pdf (
 )
) - Custom (
 ).
).
You can share a link to this report directly with your colleagues which they can open by logging into Typhoon Test Hub. If you want to check more information about the Execution which generated a specific report, simply click on the link under the “Executors” to return to the details in TTH. Tags for a specific report can be added prior to Execution or after Execution. You can see them in the Report details Overview section (Figure 6).
You can change the number of items in the table in the Navigator tab.
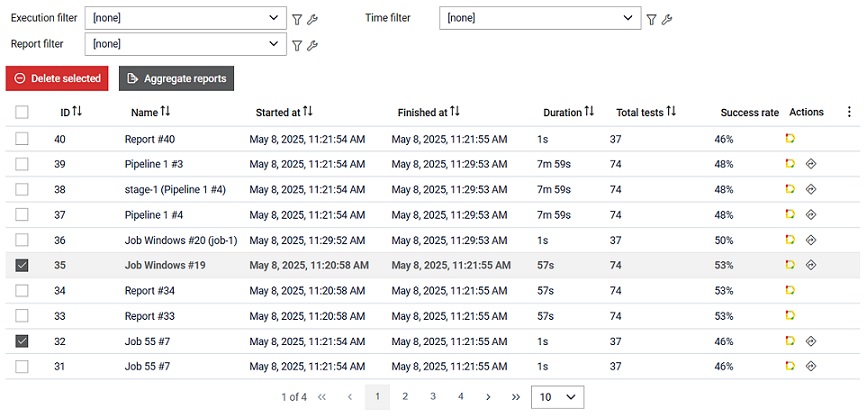
Reports can be filtered out by using the filtering section above the table. Filtering section is shown in Figure 3, which shows that executions can be filtered using Execution, Time and Report filters.

By clicking on the customize filter  button, the
filter can be customized. If an existing filter is already selected, its data will be prepopulated in
the dialog. Conversely, if no filter is selected, the user can create a custom filter through the opened
dialog.
By clicking on the manage filters
button, the
filter can be customized. If an existing filter is already selected, its data will be prepopulated in
the dialog. Conversely, if no filter is selected, the user can create a custom filter through the opened
dialog.
By clicking on the manage filters  button,
the user will be redirected to the filters page, where they can view and edit the filters if needed.
button,
the user will be redirected to the filters page, where they can view and edit the filters if needed.
Actions available when multiple items checked in the table
- Delete - As shown in the figure below selected items can be
deleted by clicking on the
 button. Once the button is clicked, the user
will see a dialog prompting them to confirm the deletion of the selected
items.
button. Once the button is clicked, the user
will see a dialog prompting them to confirm the deletion of the selected
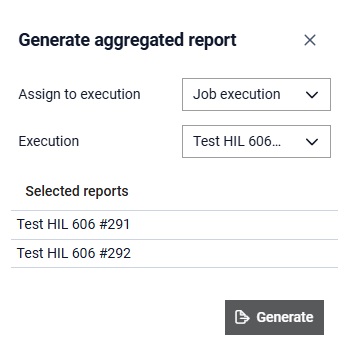
items. - Aggregate reports - As shown in the figure below selected
items can be aggregated by clicking on the
 button. Once the button is clicked, the user will see a dialog prompting
them to provide additional information about the aggregated report. This
will be explained further below.
button. Once the button is clicked, the user will see a dialog prompting
them to provide additional information about the aggregated report. This
will be explained further below.
Report aggregation
Once the items are checked and the report aggregation is initiated, a verification is made to ensure which of the selected reports are available for aggreagation. This means that the selected reports must be Allure reports, they must be collected using the collect allure-results option, and their allure-results are preserved by the Hub. For more information on report collection, please refer to relevant documentation.
Report details
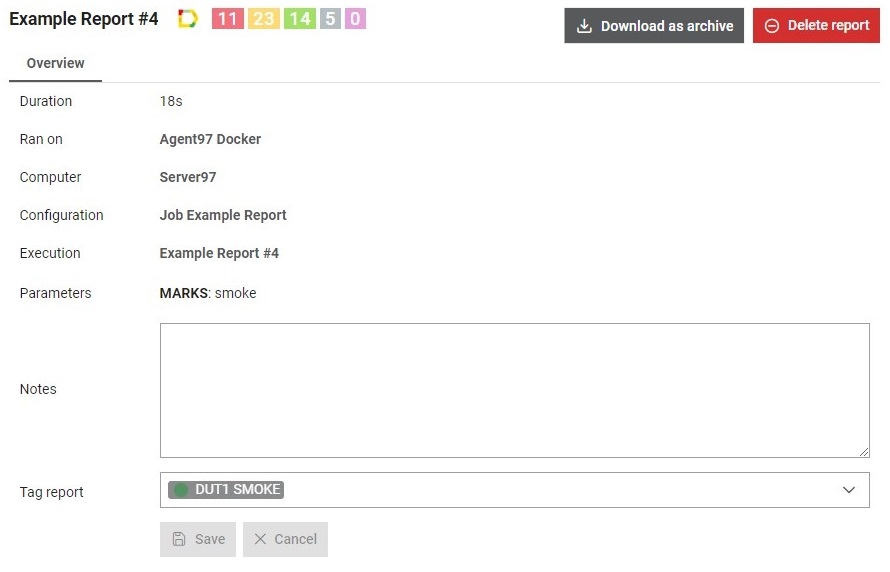
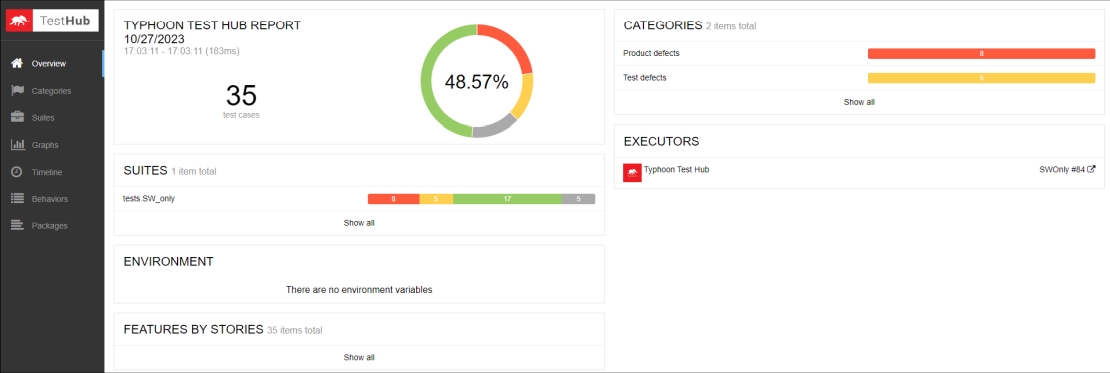
In the Overview section, you can find basic information about the selected report, as well as add notes and update report tags.
In the Report Header you can click on the colored numbers
 to directly open filtered Allure
report. By clicking on the Allure button (), an Allure
report will be opened without any filtering of the test results. If the report
selected is not Allure, but any other type, button will also enable opening of the
chosen report. The option to delete a report is available by clicking on the
to directly open filtered Allure
report. By clicking on the Allure button (), an Allure
report will be opened without any filtering of the test results. If the report
selected is not Allure, but any other type, button will also enable opening of the
chosen report. The option to delete a report is available by clicking on the
 button. A report
can be exported to PDF by clicking on the
button. A report
can be exported to PDF by clicking on the  button.
By clicking on the button
button.
By clicking on the button  the report can be exported as archive, or report data
(executed tests statuses and individual assertions or metrics) can be downloaded in
one of the following formats: json, xml and csv.
the report can be exported as archive, or report data
(executed tests statuses and individual assertions or metrics) can be downloaded in
one of the following formats: json, xml and csv.
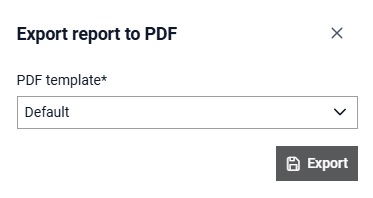
Export Allure report to PDF
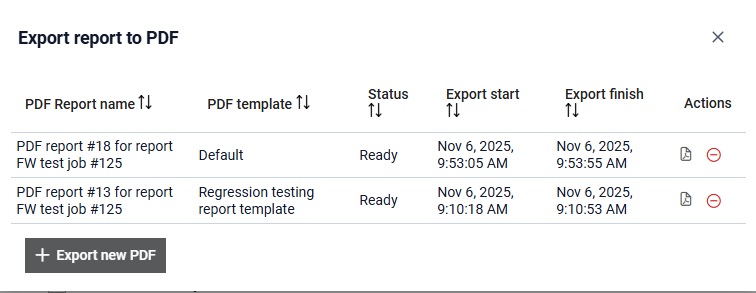
Allure report can be exported to PDF via the dialog that is shown in the picture
above. PDF export relies on TyphoonTest PDF reporting functionality.
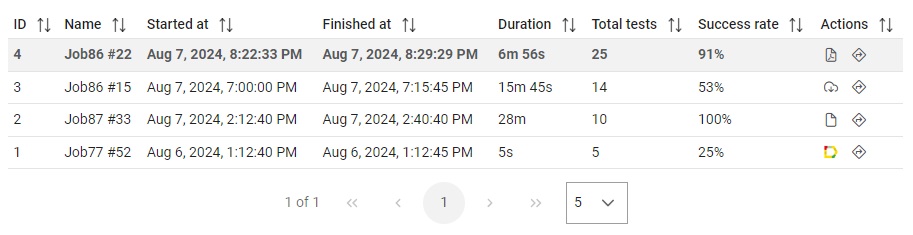
The image above shows list of previously generated PDF reports for
the selected Allure report. By clicking button  the selected PDF report is opened in the new tab. By clicking button
  the selected PDF report is deleted.
 opens
dialog for PDF template selection.
opens
dialog for PDF template selection.