Executions
Overview on how to track Executions on the Analyze section of Typhoon Test Hub.
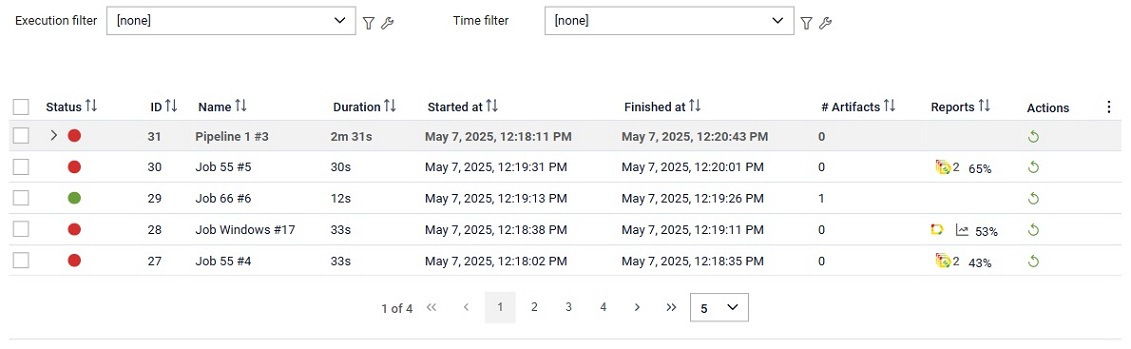
An Execution is created whenever a Job, Pipeline or Manual job is started. You can see the most important information about executions in the Executions table (Figure 1).
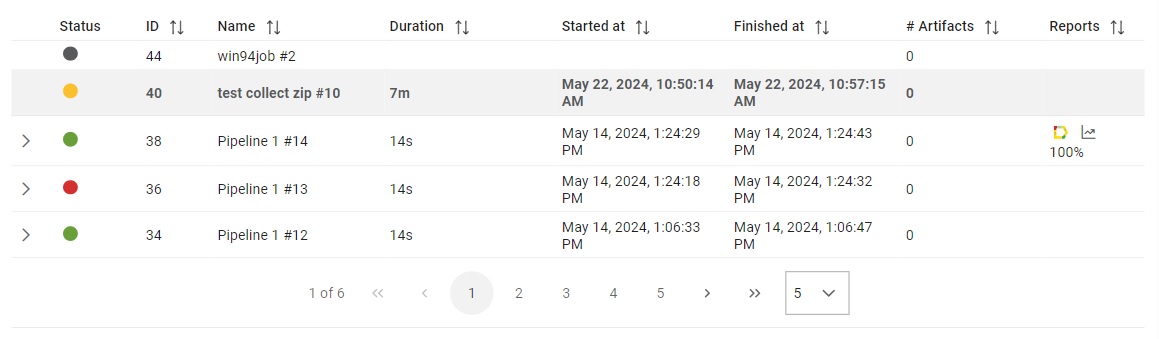
The Executions table shows the following information:
- Status of execution:
 -
Failed
-
Failed -
Broken
-
Broken -
Stopped by specific user or Hub
-
Stopped by specific user or Hub -
Passed
-
Passed - Queued
(waiting in a queue to start)
- Queued
(waiting in a queue to start) -
Running
-
Running - Idle
or Skipped
- Idle
or Skipped
- ID unique execution identifier
- Name of the job from which the execution is created
- Duration of execution
- Time when execution started
- Time when execution finished
- Number of execution
- Report statistics
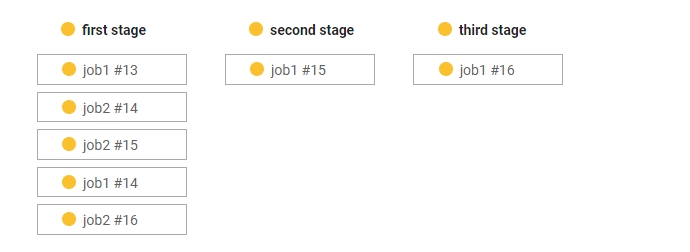
Pipelines can be expanded to show the list of stages and jobs inside stages.
You can open any generated Allure report by clicking on the
Allure icon ( ). Also, you can focus on a generated report by clicking on the Report
button (
). Also, you can focus on a generated report by clicking on the Report
button ( ) which
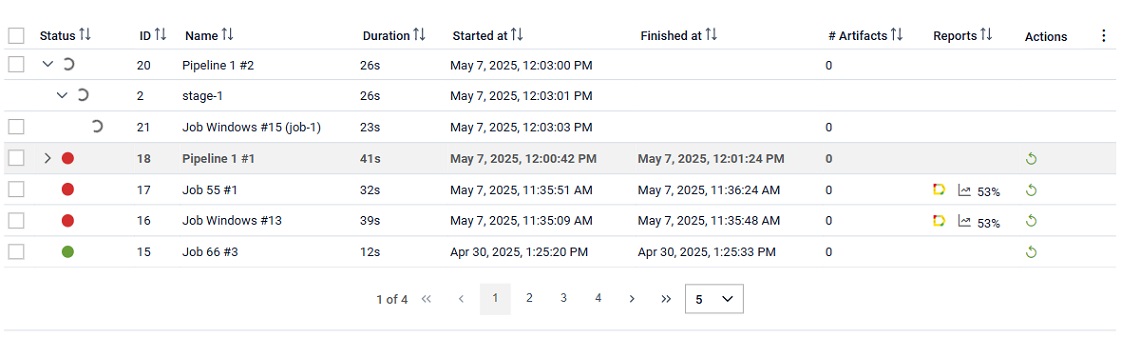
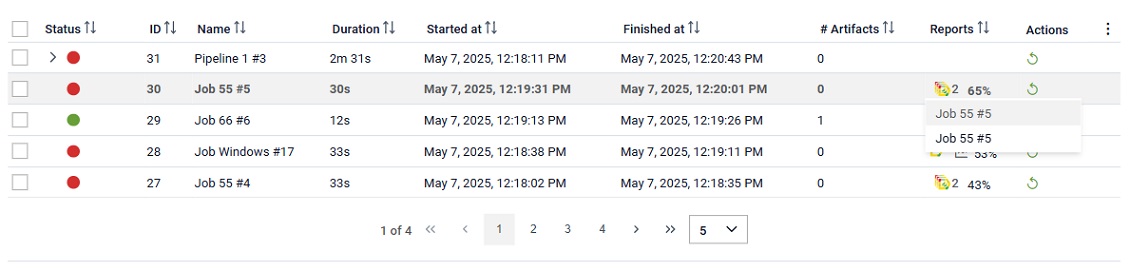
will open chosen report on the report page. In case an execution produces more
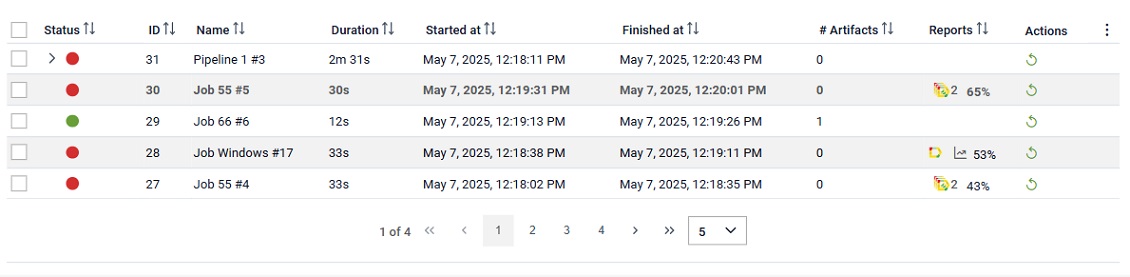
than one report, the preview will look like in the Figure below, where
the number of generated reports will be displayed next to the multiple Allure reports
icon (
) which
will open chosen report on the report page. In case an execution produces more
than one report, the preview will look like in the Figure below, where
the number of generated reports will be displayed next to the multiple Allure reports
icon ( )
button. By clicking the multiple reports Allure button, a list of all reports will appear
as shown in the Figure below.
Clicking on any report will open the Allure report in a new browser tab.
If the report is not Allure, but any other type, button will also enable
opening of the chosen report.
)
button. By clicking the multiple reports Allure button, a list of all reports will appear
as shown in the Figure below.
Clicking on any report will open the Allure report in a new browser tab.
If the report is not Allure, but any other type, button will also enable
opening of the chosen report.
If the execution is not Running or Queued, in the Actions column,
 button will be visible
which enables replay of the execution with the same configuration.
button will be visible
which enables replay of the execution with the same configuration.
You can change the number of items in the table in the Navigator tab.
 button, columns of the table
can be customized - hidden or shown depending on the preference. Columns of the table
can be reordered by using drag and drop in the table header. When positioning cursor in
between two columns, cursor for column resizing will show and enable change of the
column's width. All changes made to the table will be automatically preserved.
button, columns of the table
can be customized - hidden or shown depending on the preference. Columns of the table
can be reordered by using drag and drop in the table header. When positioning cursor in
between two columns, cursor for column resizing will show and enable change of the
column's width. All changes made to the table will be automatically preserved. Executions can be filtered out by using the filtering section above the table. Filtering section is shown in Figure 5, which shows that executions can be filtered using Execution or Time filters.
By clicking on the customize filter  button, the
filter can be customized. If an existing filter is already selected, its data will be prepopulated in
the dialog. Conversely, if no filter is selected, the user can create a custom filter through the opened
dialog.
By clicking on the manage filters
button, the
filter can be customized. If an existing filter is already selected, its data will be prepopulated in
the dialog. Conversely, if no filter is selected, the user can create a custom filter through the opened
dialog.
By clicking on the manage filters  button,
the user will be redirected to the filters page, where they can view and edit the filters if needed.
button,
the user will be redirected to the filters page, where they can view and edit the filters if needed.
Actions available when multiple items checked in the table
- Delete - As shown in the figure below, selected items can be
deleted by clicking on the
 button. Once the button is clicked, the user
will be prompted with a dialog asking if reports and artifacts should be
deleted for all selected items as well.
button. Once the button is clicked, the user
will be prompted with a dialog asking if reports and artifacts should be
deleted for all selected items as well. - Aggregate reports - As shown in the figure below, reports from
the selected executions can be aggregated by clicking on the
 button. Once the button is clicked, the user will see a dialog prompting
them to provide additional information about the aggregated report. For more
information on report aggregation, please refer to the relevant
documentation.
button. Once the button is clicked, the user will see a dialog prompting
them to provide additional information about the aggregated report. For more
information on report aggregation, please refer to the relevant
documentation. - Stop - As shown in the figure below, selected executions can be
stopped by clicking on the
 button. Also, selected executions can be stopped
with performing additional actions as for stopping job executions.
button. Also, selected executions can be stopped
with performing additional actions as for stopping job executions.
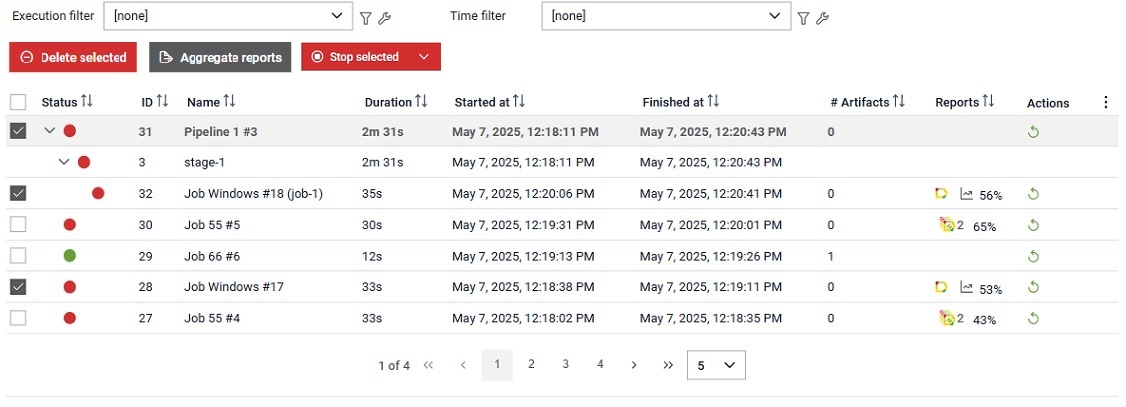
Once a pipeline execution is checked, all its nested job executions will be automatically checked as well. If necessary, any of the automatically checked nested executions can be unchecked.
Execution details
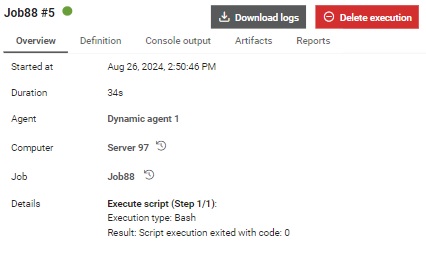
In the Details section, you can find the following tabs:
- Overview tab: Here you can see basic information and redirect by clicking on links provided. Also on the overview, execution can be marked as Preserve forever which will enable preserving it even if a global retention policy is defined and it could delete that specific execution based on its parameters.
- Definition tab: Displays definition of the Job, Pipeline or Manual job of the selected Execution.
- Console output tab: Displays logs from execution.
- Artifact tab: Contains a table of generated artifacts.
- Reports tab: Contains reports generated for the selected execution.
If the selected item is a Pipeline, the Overview tab contains basic information and a visualized pipeline.
If the selected item is a Manual job, then the Overview tab contains basic information and a visualized manual job procedure.
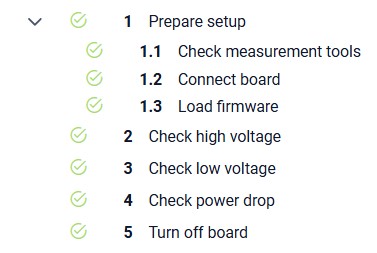
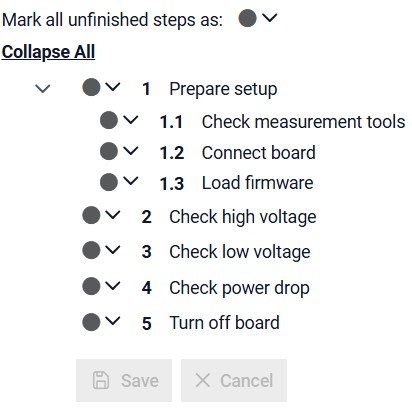
If a Manual job is still running, the Overview tab contains form for performing manual job. You can select a status for each step or its nested step from a dropdown. You can also define values for the required measurements based on their definition.
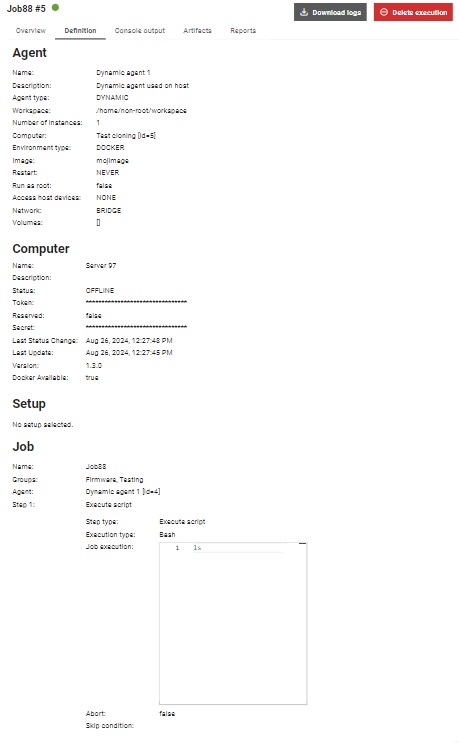
Definition tab
Data shown in the definition tab for the selected Execution presents an overview of the Job/Pipeline/Manual job used for creating selected Execution, as well as an overview of the Agent, Computer and Setup used by the selected Execution.
Running execution
When an execution is made, it will wait until the setup is free and until the agent is
available. As soon as that happens, the execution starts and the status icon changes to
a spinning icon ( )
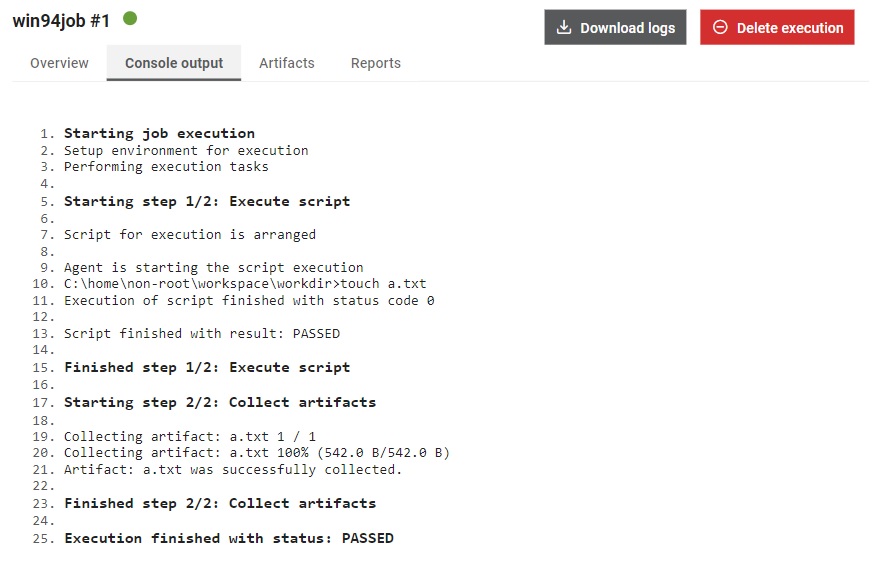
until the execution ends. While the execution is running, the Console Output
tab will display logs in real time (Figure 12). Afterwards, you can
observe all console logs.
)
until the execution ends. While the execution is running, the Console Output
tab will display logs in real time (Figure 12). Afterwards, you can
observe all console logs.
 , and if it finishes with status FAILED, the status
will become . The status becomes if the
, and if it finishes with status FAILED, the status
will become . The status becomes if the
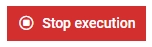 button is clicked to stop the execution. Job executions have a different stop execution
button
button is clicked to stop the execution. Job executions have a different stop execution
button  which apart from stopping the execution gives additional options. If clicked on the button
execution will be stopped like the pipeline execution. If clicked on the menu icon on the
right side of the button, user will be prompted with options:
which apart from stopping the execution gives additional options. If clicked on the button
execution will be stopped like the pipeline execution. If clicked on the menu icon on the
right side of the button, user will be prompted with options:
- Stop execution and perform additional actions - by clicking on this option,
the user will be prompted with a dialog that allows them to choose
an appropriate action. If any option is selected, it will be performed
if possible. If neither option is selected, execution will be stopped
without any additional actions.
Figure 13. Job execution delete with additional options 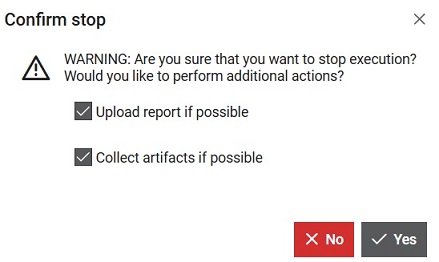
 button.
Logs of the selected Execution can be downloaded by clicking on the
button.
Logs of the selected Execution can be downloaded by clicking on the  button.
Deleting execution
Clicking on the Delete execution opens a confirmation dialog. Content of the dialog will be different depending on the type of the execution.
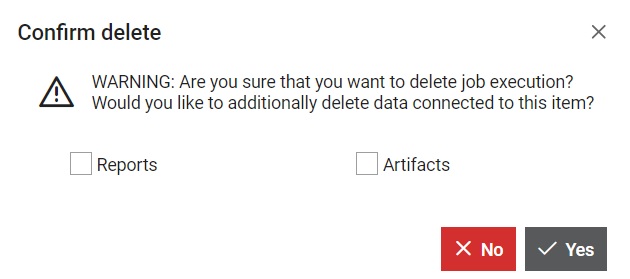
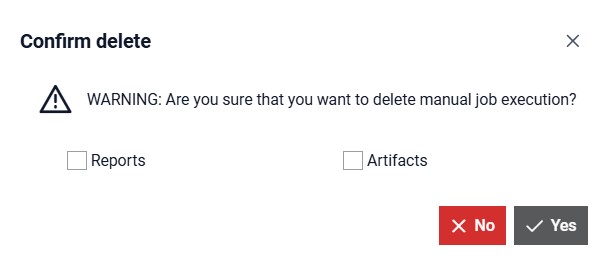
If the Reports box is checked, then all Reports connected to this Job execution will be deleted.
If the Artifacts box is checked, then all Artifacts connected to this Job execution will be deleted.
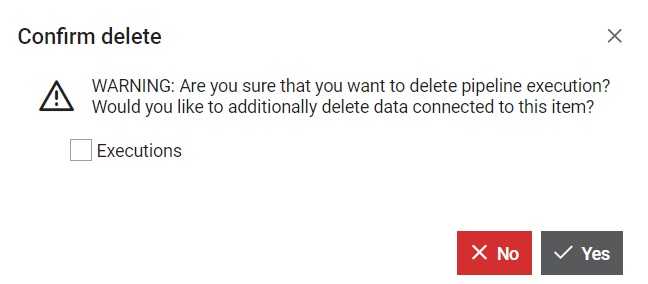
If the Executions box is checked, then all nested executions of this Pipeline will be deleted. When this option is clicked additional information in the dialog will be available.
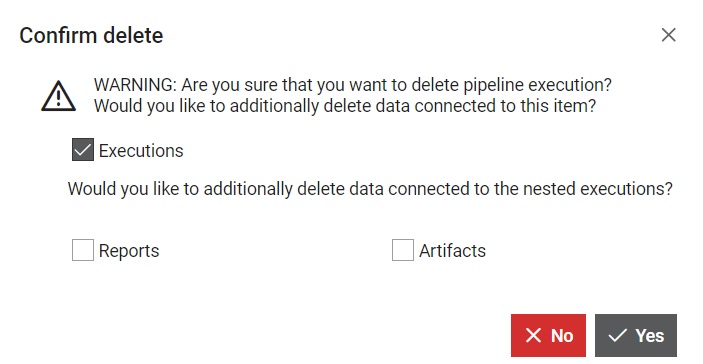
If the Reports box is checked, then all Reports connected to the nested execution of this Pipeline execution will be deleted.
If the Artifacts box is checked, then all Artifacts connected to the nested executions of this Pipeline execution will be deleted.
Uploading artifact and report for an Execution
For a Job Execution, an artifact report and a report can be uploaded from dedicated Job steps.
For a Pipeline Execution, an Allure report can be generated as an aggregated report based on the Allure reports that belong to the nested Job Executions.
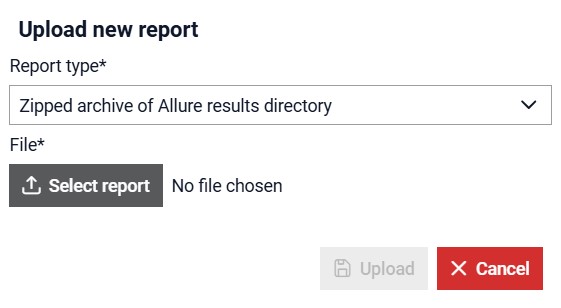
For a Manual job Executon, an artifact can be uploaded from the Artifacts tab. By
clicking the button  a dialog will appear where you can specify a type of
report and file which will be uploaded. A report can be uploaded from the
Reports tab. By clicking the button
a dialog will appear where you can specify a type of
report and file which will be uploaded. A report can be uploaded from the
Reports tab. By clicking the button  a
dialog will appear where you can specify a type of report and a file which will be
uploaded.
a
dialog will appear where you can specify a type of report and a file which will be
uploaded.